10. Debugging in Visual Studio Code
Debugging is a core feature of Visual Studio Code. In this tutorial, we will show you how to run and debug a program in VS Code. We'll take a tour of the Run and Debug view, explore some debugging features, and end by setting a breakpoint.
The Visual Studio Code editor has built-in debugging support for the Node.js runtime and can debug JavaScript, TypeScript, and many other languages that are transpiled into JavaScript. Setting up a project for Node.js debugging is straightforward with VS Code providing appropriate launch configuration defaults and snippets.
There are a few ways you can debug your Node.js programs in VS Code:
- Use auto attach to debug processes you run in VS Code's integrated terminal.
- Use the JavaScript debug terminal, similar to using the integrated terminal.
- Use a launch config to start your program, or attach to a process launched outside of VS Code.
Auto Attach#
If the Auto Attach feature is enabled, the Node debugger automatically attaches to certain Node.js processes that have been launched from VS Code's Integrated Terminal. To enable the feature, either use the Toggle Auto Attach command from the Command Palette (Ctrl+Shift+P) or, if it's already activated, use the Auto Attach Status bar item.
There are three modes for auto attach, which you can select in the resulting Quick Pick and via the debug.javascript.autoAttachFilter setting:
smart(default) - If you execute a script outside of yournode_modulesfolder or use a common 'runner' script like mocha or ts-node, the process will be debugged. You can configure the 'runner' script allow list using the Auto Attach Smart Pattern setting (debug.javascript.autoAttachSmartPattern).always- All Node.js processes launched in the Integrated Terminal will be debugged.onlyWithFlag- Only processes launched with the--inspector--inspect-brkflag will be debugged.
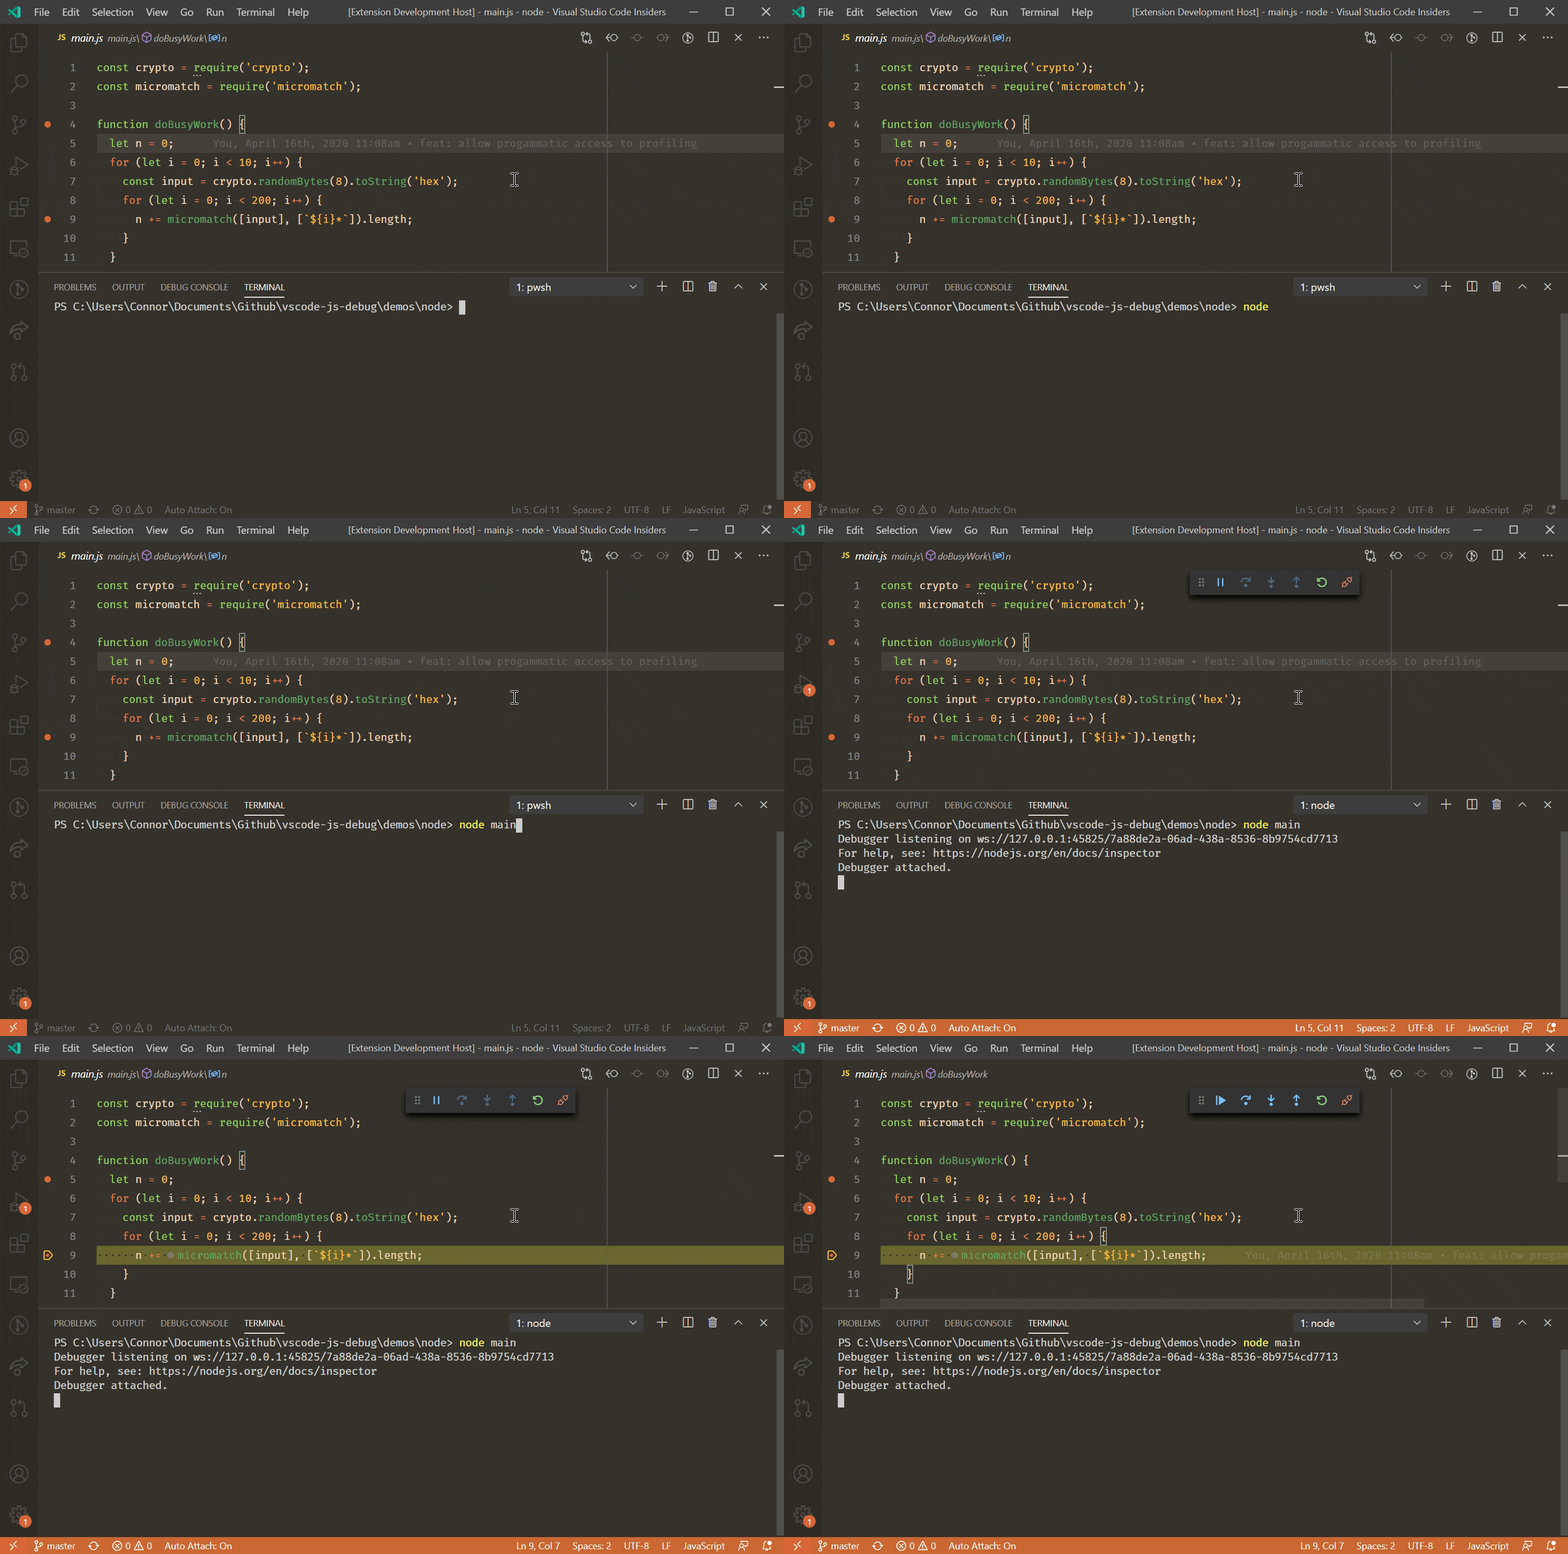
After enabling Auto Attach, you'll need to restart your terminal. This can be done by clicking the ⚠ icon in the top right of the terminal, or just creating a new one. Then, the debugger should attach to your program within a second:


Comments
Post a Comment